
Using Power BI Custom Visuals with Project Online to show Resource Engagements Data
- Allan Rocha

- Jan 25, 2016
- 2 min read
Power BI Custom Visual exists for a long time… They are amazing and gave us an unlimited amount of graphical possibilities.
Check the full list of custom visuals here: https://app.powerbi.com/visuals/

IMPORTANT: I recommend you to either, develop your own visuals or trust the company who created
Then, the sleepless Power BI Team just release great new features related to custom visuals, which are:
We can now access them by enabling custom visuals only once (if you don’t understand that, just be happy!)
We can finally PIN them on our dashboards
We can, incredible to believe, access them on our mobile devices
OMG! Seriously, this is SOOOOO COOOOLLLL…. (if you know me, you can imagine how I said that)
Ok… so let’s show what is possible to do when combining Project Online + Power BI.

First of all, you must have your data model structured.
I’m using Project Online as data source…
and Power BI Desktop
And it looks like below:

Import your favorites Power BI Custom Visuals

I will use the following custom visuals for this sample


After importing the custom visual is just about being creative and having fun…
Below is an example of a fully functional report using
Project Online
+ Resource Engagements Data
+ Power BI
+ Custom Visuals

Let’s publish the report to Power BI
The first access to the report you must Enable Custom Visuals

You only need to Enable Custom Visuals once, which is really cool!

take a look how fast it is to filter and highlight your data…

Let’s pin our charts to a dashboard

But let’s see what happen when you have pinned your charts to a dashboard

And look at this, you can see all this AMAZING VISUAL GRAPHICS in your iPad with full fidelity… OMG!
Remember to also Enable custom visuals in your iPad

Look how cool it’s when clicking on a tile in your dashboard

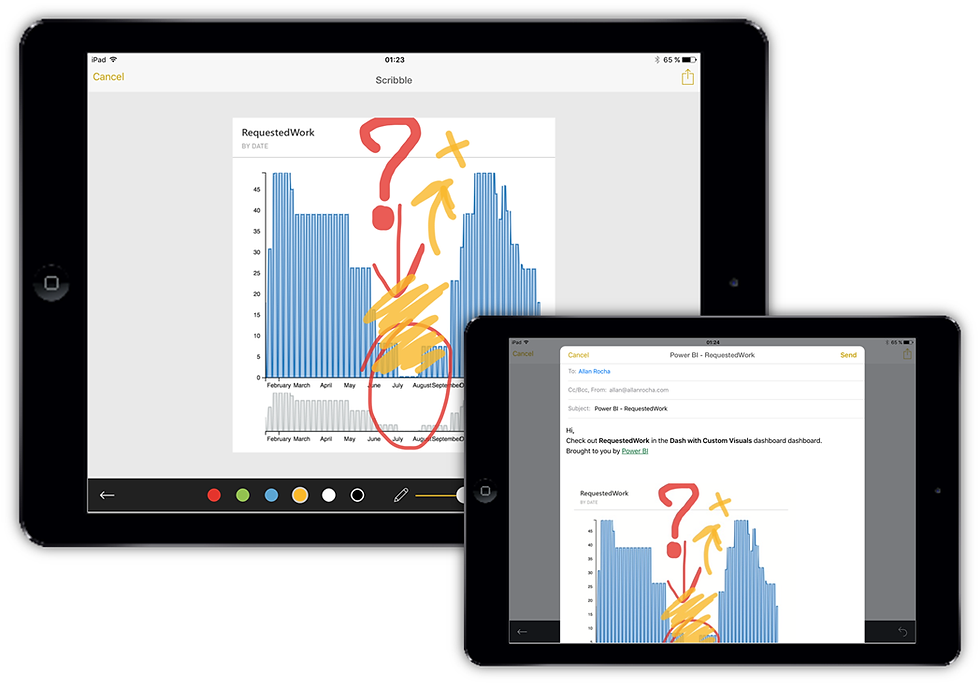
And continuing, try to imagine if you could share this gorgeous charts with a comment to your team or boss in few clicks…
Welcome to reality! YOU CAN!
And yes… it works on your iPhone exactly in the same way and with the same quality!!! I love Power BI…

Hope you like it!


Comments